continued
![]()
continued
| 3.
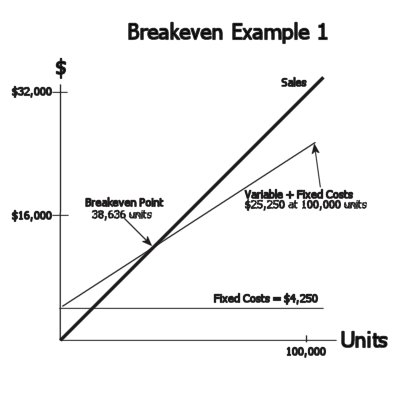
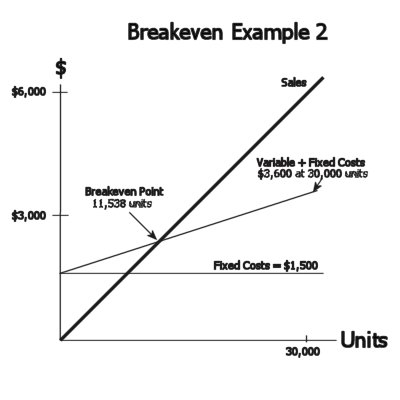
Break-Even Analysis Break-even analysis is an easy "quantitative" way to analyze opportunities. It can also be used to compare different solutions. It gives us a way to evaluate opportunities on paper before we invest our resources. It shows us clearly how many units we have to sell before we will recover our costs. We can create several break-even charts for the same opportunity varying the costs and sales numbers to help us see what might happen with different outcomes. |
|
|
Central to break-even analysis is the
formula: B-E sales = Price Each*Units = Fixed Costs + Variable Costs which means that we "break-even" when we sell enough units to cover our fixed costs plus our variable costs. Another formula provides the slope of the total cost line: Slope = Total Variable Costs / Total Quantity A desirable, lower slope number provides better return once we pass B-E sales. The B-E chart is created by drawing the "Sales" line at a 45o angle and creating a vertical axis and a horizontal axis based on the total sales expected for the total number of units sold. Once we have the $ on the vertical axis and the units on the horizontal axis we can add the line for "Fixed Costs" and then draw the "Variable Costs" from the "Fixed Cost" line and see where it intersects the "Sales" line. This is the B-E point. |
|
|
|||||||||||||||||
|
|||||||||||||
| Test Your PK Absorption |
| 1. Why is
it a good idea to use break-even analysis?
2. What does break-even analysis show us? 3. What should we do if the break-even quantity is higher than the customer wants to order? |